

Introduction
In the realm of modern applications, efficient log management and analytics play a pivotal role in ensuring smooth operations and troubleshooting.
Fluent Bit, a fast and lightweight logs and metrics processor and forwarder, emerges as a key player in this landscape. When Fluent Bit with Grafana, a powerful visualization tool, Fluent Bit opens up a world of possibilities for log processing and analysis.
What is Fluent Bit?
Fluent Bit stands out as a lightweight and fast solution for handling logs and metrics. It efficiently processes and forwards data, making it a preferred choice for organizations dealing with large volumes of telemetry information.
Its seamless integration with Grafana enhances the capabilities of log management and analytics systems.
Integrating Fluent Bit with Grafana
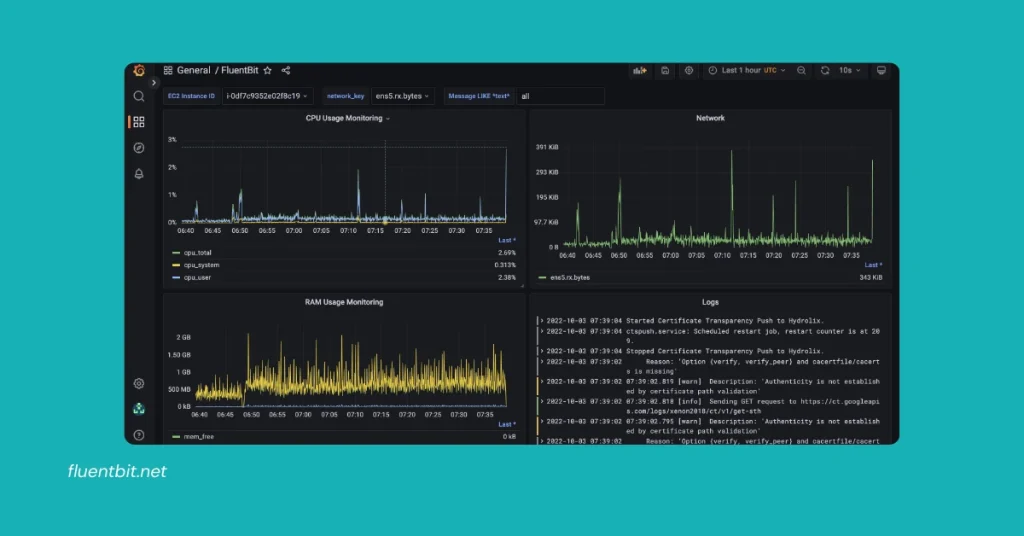
The Fluent Bit Grafana dashboard provides a comprehensive view of log data, enabling users to monitor and analyze logs effectively.
Setting up and configuring Fluent Bit with Grafana is a straightforward process, offering users a user-friendly interface to manage their log data efficiently.
Benefits of Using Fluent Bit Grafana
The collaboration between Fluent Bit and Grafana brings forth a host of benefits, including improved log management efficiency, enhanced analytics capabilities, and scalability in log processing and visualization.
This synergy empowers organizations to streamline their log management processes and derive valuable insights from their data.
Configuring Fluent Bit for Docker Container Logs
To configure Fluent Bit for Docker container logs, you can follow a step-by-step guide to set up Fluent Bit with the Fluent Bit Docker image and direct logs to Grafana Cloud’s Loki. This process ensures a smooth flow of log data from containers to the desired destination.
Step-by-Step Guide to Configuring Fluent Bit for Docker Container Logs:
Set Up Fluent Bit Docker Image:
Start by building a custom Fluent Bit Docker image. You can use the official production-ready Fluent Bit Docker images provided.
Define Input Sources:
Configure Fluent Bit to collect data from Docker containers. You can specify which containers to include or exclude for log collection.
Configure Output Destination:
Direct the collected log data to Grafana Cloud’s Loki. Set up Fluent Bit to forward logs to Loki for centralized log management and analysis.
Run Fluent Bit Container:
Once the configuration is set up, run the Fluent Bit container with the specified settings.
Verify Log Forwarding:
Check the Grafana Cloud’s Loki interface to confirm that log data from Docker containers is successfully reaching the destination. By following these steps, you can effectively configure Fluent Bit to handle Docker container logs and seamlessly forward them to Grafana Cloud’s Loki for centralized log management and analytics.
This setup enhances your log processing capabilities and enables efficient monitoring and troubleshooting of Docker container activities.
Configuring Fluent Bit for Kubernetes
To configure FluentBit for Kubernetes log management, you can deploy Fluent Bit as a DaemonSet and leverage the Fluent Bit Helm chart along with the Grafana Fluent Bit plugin. This setup ensures comprehensive log collection and processing for all Kubernetes workloads.
Deploying Fluent Bit as a DaemonSet in Kubernetes
Set up the Fluent Bit DaemonSet:
Fluent Bit should be deployed as a DaemonSet in Kubernetes to ensure that it runs on every node in the cluster
Configure Fluent Bit for Kubernetes:
Fluent Bit’s built-in Kubernetes filter plugin communicates with the Kubernetes API server to retrieve metadata for each log entry
Set up Fluent Bit Helm Chart:
The recommended way to deploy Fluent Bit in Kubernetes is by using the official Fluent Bit Helm Chart
Configure Fluent Bit Parsers:
Fluent Bit uses parsers to interpret log data and extract relevant information
Define Input Sources:
Configure Fluent Bit to collect logs from the desired sources, such as container log files or specific log paths
Configure Output Destinations:
Define the output destinations for the collected logs, such as Elasticsearch, InfluxDB, or HTTP
Integrate with Grafana:
To enhance log visualization and analysis, integrate Fluent Bit with Grafana using the Grafana Fluent Bit plugin.
Conclusion
The collaboration between Fluent Bit and Grafana, highlighted in this article, showcases the power of efficient log management and analytics.
By leveraging Fluent Bit’s capabilities with Grafana’s visualization prowess, organizations can unlock new levels of efficiency and insights in handling their log data.
As the demand for streamlined log management and advanced analytics grows, the partnership between Fluent Bit and Grafana is poised to evolve further, offering enhanced features and functionalities to meet the dynamic needs of modern applications.
FAQs
What is Fluent Bit and Grafana?
Fluent Bit is a lightweight and fast logs and metrics processor and forwarder, while Grafana is a powerful visualization tool used for monitoring and analytics.
How does Fluent Bit work with Grafana?
Fluent Bit efficiently processes and forwards log data, which can then be visualized and analyzed using Grafana’s intuitive dashboard interface.
What are the benefits of using Fluent Bit with Grafana?
The collaboration between Fluent Bit and Grafana offers improved log management efficiency, enhanced analytics capabilities, and scalability in log processing and visualization.
How can I configure Fluent Bit for Docker container logs?
Configuring Fluent Bit for Docker container logs involves using the Fluent Bit Docker image and setting it up to forward logs directly to Grafana Cloud’s Loki.
How do I set up Fluent Bit for Kubernetes?
Running Fluent Bit as a Daemonset in Kubernetes allows for the collection of all Kubernetes workload logs. The Fluent Bit helm chart with the Grafana Fluent Bit plugin can further enhance log processing capabilities.
Latest Post:
- Best Practices for Fluent Bit Output Matching in Complex Pipelines
- Setting Up Fluent Bit with Open Telemetry for Unified Observability
- Fluent Bit vs Fluentd: Choosing the Right Tool for OpenSearch Logging
- How to Use fluent-plugin-opensearch for Fluentd Pipelines
- Is Ansys Fluent Better for Complex Fluid Flow Simulations?