Table of Contents
ToggleIntroduction
Monitoring and metrics collection are crucial for ensuring the smooth operation of applications and infrastructure.
Two popular tools for this purpose are FluentBit and Prometheus. While both tools are used for metrics collection, they have different approaches and use cases. In this article, we’ll delve into the differences between Fluent Bit vs Prometheus, exploring their features, configurations, and use cases.

Fluent Bit: A Log Shipper and Metrics Collector
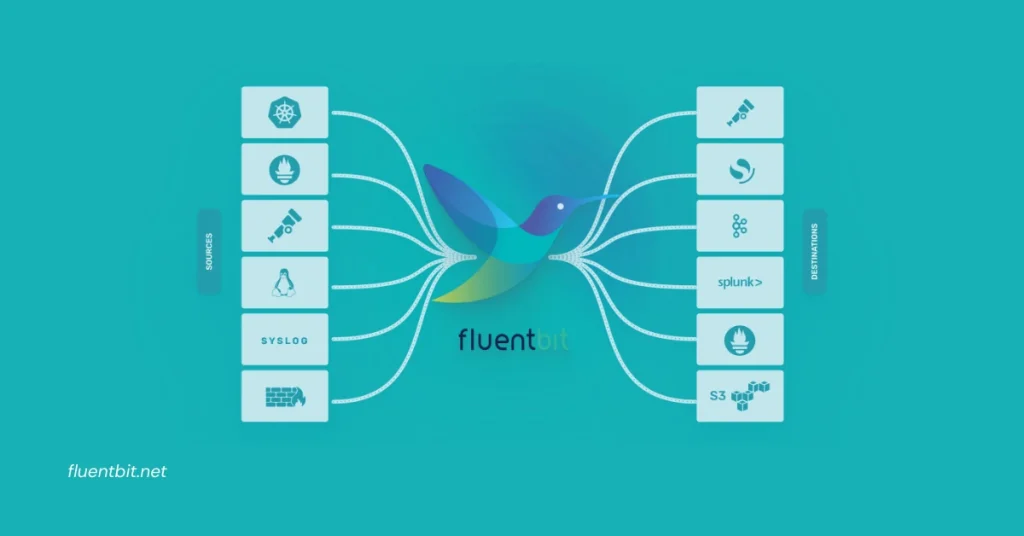
Fluent Bit is a log shipper and metrics collector that allows you to create a data pipeline based on your inputs, filters, and outputs. It’s known for its ease of configuration, enabling you to collect, transform, and push logs, metrics, and traces from anywhere to anywhere. Fluent Bit Filtering supports a wide range of inputs and outputs, making it a versatile tool for monitoring and metrics collection.
Fluent Bit Configuration
Configuring Fluent Bit involves setting up inputs to collect data, filters to transform the data, and outputs to forward the data to destinations like Prometheus or Grafana. For example, you can configure Fluent Bit to collect node metrics from a Linux machine and forward them to Grafana for analysis.
Prometheus: A Time Series Database
Prometheus is an open-source time series database developed by SoundCloud, serving as the storage layer for the Prometheus monitoring system.
- It is designed for monitoring and metric collection, featuring a user-defined multi-dimensional data model and a query language called PromQL.
- The database has evolved through three major versions, with each version addressing various shortcomings and introducing improvements in storage and data handling.
In Prometheus, time series are defined by a metric and a set of key-value labels, uniquely identified by their name and labels.
- The database supports various metric types and operations like Inc(), Add(float), Set(float), Observe(float), and more. Prometheus uses compression techniques for timestamps and numerical values to optimize storage efficiency.
- Prometheus operates independently for reliability, relying solely on local storage and written in Go, making it easy to deploy.
- It supports multiple modes for visualizing data, including a built-in expression browser, Grafana integration, and a console template language. Alerts in Prometheus are defined using PromQL and maintain dimensional information, with an alertmanager handling notifications and silencing.
Cloudflare, for instance, runs over 900 instances of Prometheus with around 4.9 billion time series, using it to gain insights into their network’s health and performance over time.
The database’s memory usage is optimized through steps like HTTP scraping, identifying new time series, and compressing samples efficiently
Prometheus Exporter in Fluent Bit
Fluent Bit has a Prometheus exporter that allows you to take metrics from Fluent Bit and expose them so that a Prometheus instance can scrape them.
This exporter only works with metric plugins, such as Node Exporter Metrics, and allows you to add custom labels to all metrics exposed through the Prometheus exporter.
Fluent Bit vs Prometheus – Key Differences and Use Cases
The main difference between Fluent Bit and Prometheus lies in their design and purpose.
- Fluent Bit is a log shipper and metrics collector that can forward data to various destinations, while Prometheus is a TSDB that specializes in handling application metrics.
- Fluent Bit is more versatile and can be used for a broader range of monitoring and metrics collection tasks, while Prometheus excels at handling application metrics and integrating with alerting tools like Alertmanager.
Conclusion
In conclusion, Fluent Bit and Prometheus are both valuable tools for monitoring and metrics collection, but they serve different purposes.
Fluent Bit is a log shipper and metrics collector that can forward data to various destinations, while Prometheus is a TSDB that specializes in handling application metrics. Understanding the strengths and weaknesses of each tool is crucial for choosing the right one for your monitoring and metrics collection needs.
FAQs
Q: What is Fluent Bit?
A: Fluent Bit is a log shipper and metrics collector that allows you to create a data pipeline based on your inputs, filters, and outputs. It’s known for its ease of configuration, enabling you to collect, transform, and push logs, metrics, and traces from anywhere to anywhere.
Q: What is Prometheus?
A: Prometheus is a time series database (TSDB) that handles application metrics specifically. It scrapes data and metrics from exporters and displays them, making it a powerful tool for monitoring application performance.
Q: How do I configure Fluent Bit?
A: Configuring Fluent Bit involves setting up inputs to collect data, filters to transform the data, and outputs to forward the data to destinations like Prometheus or Grafana.
Q: Can Fluent Bit forward data to Prometheus?
A: Yes, Fluent Bit has a Prometheus exporter that allows you to take metrics from Fluent Bit and expose them so that a Prometheus instance can scrape them.
Q: What is the main difference between Fluent Bit and Prometheus?
A: The main difference between Fluent Bit and Prometheus lies in their design and purpose. Fluent Bit is a log shipper and metrics collector that can forward data to various destinations, while Prometheus is a TSDB that specializes in handling application metrics.
Latest Post:
- Best Practices for Fluent Bit Output Matching in Complex Pipelines
- Setting Up Fluent Bit with Open Telemetry for Unified Observability
- Fluent Bit vs Fluentd: Choosing the Right Tool for OpenSearch Logging
- How to Use fluent-plugin-opensearch for Fluentd Pipelines
- Is Ansys Fluent Better for Complex Fluid Flow Simulations?


