Table of Contents
ToggleIntroduction
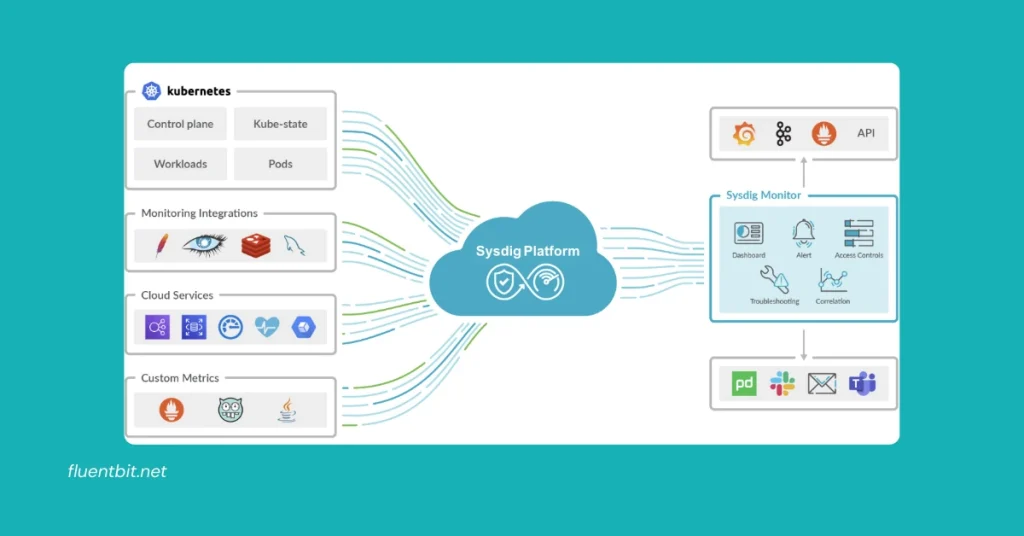
In the realm of monitoring systems, Prometheus stands out as a powerful tool for collecting and analyzing metrics. Its significance lies in its ability to scrape metrics from targets, providing valuable insights into system performance and behavior.
For applications like the Xenia Canary Compatibility List, where real-time monitoring is crucial, Prometheus’ scraping capabilities are essential.
In this article, we’ll delve into the world of Prometheus scrape metrics, exploring how to correctly scrape and query metrics, understanding the philosophy behind Prometheus, and getting started with configuring Prometheus for efficient monitoring.

How to Correctly Scrape and Query Metrics in Prometheus Every Hour
To scrape metrics in Prometheus, you need to set the global scrape interval in the prometheus.yml file. For instance, to scrape metrics every hour, you would set scrape_interval: 1h.
- However, this approach may not align with Prometheus’ design principles, which emphasize frequent scraping to ensure up-to-date metrics.
- To increase the validity of scrape data without frequent scraping, you can consider alternative solutions like scheduling a job to send data to a push gateway or using a prom file fed to a node exporter.
Understanding the Philosophy of Prometheus
Prometheus, an open-source monitoring solution, is built with a philosophy that emphasizes frequent scraping of metrics to ensure accuracy and real-time monitoring capabilities.
This philosophy is rooted in the core design principles of Prometheus, which prioritize active metric retrieval through a pull-based approach. Here is an in-depth exploration of the philosophy behind Prometheus:
Pull-Based Approach:
Prometheus adopts a pull-based approach, actively scraping targets to retrieve metrics from them. This method ensures that Prometheus collects data proactively, enabling real-time monitoring and analysis of system performance.
Centralized Control:
One key aspect of Prometheus’ philosophy is centralized control. Configuration settings are managed on the Prometheus server side, allowing administrators to determine which targets to scrape and how frequently to scrape them.
This centralized control enhances flexibility and customization in monitoring setups.
In-Built Alerting Facility:
Prometheus offers an in-built alerting facility that pushes alerts to the Alert manager based on custom rules defined in configuration files.
This feature enables users to set up notifications to various endpoints like Slack or Google Hangouts, enhancing the system’s ability to respond to critical events promptly.
Service Discovery:
Another crucial aspect of Prometheus’ philosophy is service discovery. Prometheus can dynamically discover targets and automatically scrape new targets on demand.
This capability simplifies the management of monitoring configurations, especially in dynamic environments like Kubernetes or Consul
Getting Started with Prometheus
To get started with Prometheus, you need to configure it to monitor itself. This involves creating a prometheus.yml file with the necessary scrape configurations and deploying Prometheus using Kubernetes.
Prometheus collects metrics from targets by scraping metrics HTTP endpoints, making it a powerful tool for monitoring systems like the Xenia Canary Compatibility List.
Prometheus Scrape Metrics 3.0
The Prometheus Scrape Metrics 3.0 feature marks a significant milestone in the evolution of Prometheus.
- It introduces new features and improvements that enhance the efficiency and accuracy of scrape metrics.
- To configure Fluent Bit to scrape metrics from a Prometheus-based endpoint, you need to create a fluent-bit.conf file with the necessary input and output configurations.
- The benefits of using Fluent Bit for collecting both logs and metrics lie in its ability to provide a unified view of system performance and behavior.
Conclusion
In conclusion, scraping metrics in Prometheus is a crucial aspect of monitoring systems like the Xenia Canary Compatibility List.
By understanding how to correctly scrape and query metrics, the philosophy behind Prometheus, and how to get started with configuring Prometheus, you can unlock efficient monitoring for your applications.
The Prometheus Scrape Metrics 3.0 feature takes this to the next level of Fluent bit filtering, providing a powerful tool for collecting and analyzing metrics. As we move forward in the world of monitoring and analytics, the importance of scraping metrics in Prometheus will only continue to grow.
FAQs
Q: How can I correctly scrape and query metrics in Prometheus every hour?
A: To scrape metrics every hour in Prometheus, you can set the global scrape interval in the prometheus.yml file. However, frequent scraping is recommended to ensure up-to-date metrics.
Q: What are the implications of the staleness strategy in Prometheus?
A: The staleness strategy in Prometheus affects the validity of scrape data. Increasing the time that scrape data is valid without frequent scraping can be achieved through alternative solutions like using a push gateway or a node exporter.
Q: Why may scraping every hour not align with Prometheus’ design principles?
A: Prometheus is designed with a philosophy that emphasizes frequent scraping to ensure accurate and up-to-date metrics. Scraping every hour may lead to stale metrics.
Q: How can I configure Fluent Bit to scrape metrics from a Prometheus-based endpoint?
A: To configure Fluent Bit for scraping metrics, you need to create a fluent-bit.conf file with the necessary input and output configurations. FluentBit offers the benefit of collecting both logs and metrics for a unified view of system performance.
Q: What is the importance of understanding Prometheus’ design principles?
A: Understanding Prometheus’ design principles is crucial for efficient monitoring and ensuring accurate insights into system performance. It guides the configuration of scrape metrics for optimal results.
Q: How does Prometheus collect metrics from targets?
A: Prometheus collects metrics from targets by scraping metrics HTTP endpoints. This process allows Prometheus to gather data for monitoring and analysis.
Latest Post:
- Best Practices for Fluent Bit Output Matching in Complex Pipelines
- Setting Up Fluent Bit with Open Telemetry for Unified Observability
- Fluent Bit vs Fluentd: Choosing the Right Tool for OpenSearch Logging
- How to Use fluent-plugin-opensearch for Fluentd Pipelines
- Is Ansys Fluent Better for Complex Fluid Flow Simulations?


